Efficient Use of Diagnostic Imaging and Objective Evaluation of Work that Reflects Patient Condition
Shida K, Uto Y, Muranaga F, Iwaanaguchi T, Kumamoto I
DOI10.21767/2471-9927.100030
Keiichi Shida*, Yumiko Uto, Fuminori Muranaga, Takashi Iwaanaguchi and Ichirou Kumamoto
Kagoshima University Graduate School of Medical and Dental Sciences, Kagoshima, Japan
- *Corresponding Author:
- Keiichi Shida
Kagoshima University Graduate School of Medical and Dental Sciences
Kagoshima, Japan
Tel: +81-0994-57-8333
E-mail: shida@fmt.teikyo-u.ac.jp
Received Date: June 26, 2016; Accepted Date: July 03, 2017; Published Date: July 13, 2017
Citation: Shida K, Uto Y, Muranaga F, Iwaanaguchi T, Kumamoto I (2017) Efficient Use of Diagnostic Imaging and Objective Evaluation of Work that Reflects Patient Condition. J Health Med Econ. Vol. 3 No. 1:4
Abstract
In this study, as a secondary use of data stored on the hospital’s information system, we developed a tool for calculating scan time and personnel cost based on patient condition with a view to realizing safe photographic testing that is tailored to the needs of the aging society, and improving the labour environment. We also calculated personnel costs-as a medical resources input-with the aim to promote the appropriate placement of medical staff and the objective evaluations of work. We utilized data accumulated in the hospital information system to ascertain patient conditions and classified the patients according to patient condition. We calculated the non-enhanced head CT scan times, and then obtained scan time coefficients and personnel cost coefficients. The mean scan time per non-enhanced head CT scan was 5.82 ± 3.83 minutes. The equivalent figure for “carried/freedom level 1” patients was, at 6.59 ± 4.27 minutes, longer than the mean examination time. The personnel costs for scans administered to “unassisted walking” patients were one third of the costs for scans administered to “carried/freedom level 1” patients, suggesting that personnel costs for the same type of scan vary depending on patient condition. Thus, more accurate scan time predictions can be achieved by referring to conveyance category, and especially to freedom level. Furthermore, personnel cost coefficients can serve as a yardstick for making objective evaluations of work.
https://maviyolculuk.online/
https://mavitur.online/
https://marmaristeknekirala.com.tr
https://tekneturumarmaris.com.tr
https://bodrumteknekirala.com.tr
https://gocekteknekirala.com.tr
https://fethiyeteknekirala.com.tr
Keywords
Patient conditions; Computed tomography scanner; Electronic medical chart system
Introduction
In Japan, the birth-rate is decreasing and the population is aging at a rapid rate. Accordingly, keeping medical spending in check has become an urgent matter. Japan introduced integrated medical assessments based on a diagnostic group classification. Diagnosis Procedure Combination (DPC) was developed [1,2]. Under this system, hospitals are required to provide each patient with nonwasteful, efficient medical services. Local hospitals are required to differentiate functions and there is a need to concentrate and utilize limited resources effectively [3]. One important step to improve the concentration of medical resources and the profitability of hospitals is to use high-cost medical apparatuses (e.g., diagnostic imaging) as efficiently as possible [4,5]. However, the number of CT scanners per million people in Japan is 101.28, which is three times the Organization for Economic Cooperation and Development (OECD) average (31.07). Thus, medical resources are not being concentrated. However, Japan has embarked on a policy of functional differentiation in medical institutions, and has started supporting the appropriate and efficient use of highcost, advanced diagnostic apparatuses through the system of medical service fees. If, in the future, the government controls excessive medical infrastructure investments and promotes the consolidation of hospitals with advanced medical apparatuses, this will lead to the concentration of the relevant diagnostic tests, and to a significant increase in the number of diagnostic tests per facility.
One advanced medical apparatus with a particularly high proliferation rate is CT. Except in emergencies; CT scans are booked in certain time frames that are determined based on the scan protocol. Reports on CT costs have given consideration to variations in protocol and modality [6,7]. However, even if the scan itself is the same, the patient’s condition or activities of daily living (ADLs) may necessitate extra time being spent on processes such as moving the patient onto the CT bed, resulting in a longer scan time. Thus, even if the type of CT scan is the same, the medical services provided can vary depending on the patient’s condition and ADLs, and this creates discrepancies in medical resources input; however, few studies have treated this as an issue [8].
Objectives
In this study, as a secondary use of data stored on the hospital’s information system, we developed a tool for calculating scan time and personnel cost based on patient condition with a view to realizing safe photographic testing that is tailored to the needs of the aging society, and improving the labour environment.
Methods
From April 1, 2014, to March 31, 2015, we analysed patients who stayed at Kagohsima University Hospital and underwent in-hospital neurosurgical testing with non-enhanced head CT scan. We analysed non-enhanced head CT scan because the photography method is standardized for all patients.
Kagoshima University Hospital introduced a comprehensive information system to support medical services and management [9,10]. It introduced a nursing system capable of calculating the quantity of nursing [11]. We used these systems to extract the necessary data. The items we extracted were the names of principal disease, CT reception and implementation times, conveyance category, and freedom level. We assigned the patients to a category based on the conveyance category and freedom level items, and then calculated their scan times.
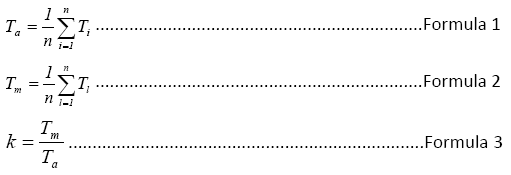
Obtaining scan time coefficients
We represented the scan time for each patient as Ti, and the quantity of items of the data as n, and calculated the mean scan time (Ta) using Formula 1. We calculated the mean scan time for each conveyance category/freedom level (Tm) using Formula 2. Based on the results, we sought the mean scan time coefficient (k) using Formula 3.
Obtaining personnel cost coefficient
For the personnel cost coefficients, we referred to the relative value unit (RVU) method. This method comprises four steps: [12-15] (1) Create treatment cost profile; (2) calculate RVU from raw treatment cost profile; (3) use RVU to obtain total-RVU and raw cost-per-1RVU; (4) use RVU to calculate weighted raw cost by patient. In this study, we followed the first two steps to obtain the coefficients for personnel cost. We treated the number of staff involved in a scan as the raw treatment cost profile (Table 1). The data we used to determine these staff numbers was the “personnel placements” outlined in the Japan Nursing Association’s Nursing Practice Guidelines. “Carrying” requires one nurse and one auxiliary nurse. “Assisted” requires one auxiliary nurse and one radiological technologist as the examiner. In the case of “unassisted walking,” as the patient moves to the CT scan location by him/herself, the only staff member required is a radiological technologist as the examiner. The data we used to determine the mean monthly salary and mandatory working hours for each discipline (nurse/auxiliary nurse/radiological technologist) was the Ministry of Health, Labour and Welfare’s 2014 Basic Survey on Wage Structure, and the Basic Survey on Wage Structure of hospitals with more than 1000 staff (Table 2). Based on this data, we calculated the personnel cost per 1 nonenhanced head CT scan using the following formula.
Table 1:Staff involved in the scan.
| Conveyance category | Freedom level | Staff |
|---|---|---|
| Carrying | I | One radiologist technologist, one nurse and one auxiliary nurse |
| II | ||
| III | ||
| Assisted | I | One radiologist technologist, one auxiliary nurse |
| II | ||
| III | ||
| IV | ||
| Unassisted walking | IV | One radiological technologist |
Table 2: Labour and Welfare’s 2014 Basic Survey on Wage Structure, and the Basic Survey on Wage Structure of hospitals with more than 1000 staff.
| The average age | The mean duty number of years | working hours | A monthly salary | Hourly pay | |
|---|---|---|---|---|---|
| (hours/month) | (1,000 yen) | (1,000 yen) | |||
| Nurse | 34.8 | 7.5 | 157 | 341.1 | 2.17 |
| Auxiliary nurse | 43.9 | 8.3 | 157 | 205.3 | 1.31 |
| Radiological technologist | 35.7 | 10.3 | 159 | 381.3 | 2.4 |
Personnel cost per 1 non-enhanced head CT=(hourly pay of deployed staff) × (head CT mean scan time)
Having aggregated the total raw personnel cost per 1 nonenhanced head CT scan, we obtained personnel cost coefficients (r) by dividing the wage expense for each conveyance category/ freedom level by the total mean personnel cost. As we focused on scan time and personnel placements, we did not analyse the CT apparatus cost, procurement cost, or maintenance cost per CT.
Exploring the potential for applying on electronic medical chart (EMC) system
We formulated three sets of patients’ combinations based on their conditions assuming that 10 hypothetical non-enhanced head CT scan cases should take place in 1 day. We assigned an integer to each of the conveyance category/freedom level combinations, and then used Microsoft Excel to generate one of these integers randomly 10 times so as to create 10 combinations of patients’ conditions. Then, each of the ten scan cases is assigned one of these numbers randomly to create one of the three ‘patterns’. The composition of each pattern is described later in 4-3. For each pattern, we multiplied the scan time and personnel cost coefficients by the number of patients so as to simulate the scan time and the workload for scan time.
Statistical approach
The statistical software we used was SPSS version 18. We used the Kruskal–Wallis test, and for the multiple comparison, we used the Steel–Dwass test to analyse the scan times classified by conveyance category/freedom level.
Defining terms
Freedom level: This term describes the freedom of activity the patient has in his/her daily life. There are four freedom levels. Freedom level I=Bedridden; level II=Able to rise from bed; level III=Able to walk around room; and level IV=Mostly no ADL restrictions.
Conveyance category: This term describes the method by which the patient moves around inside the hospital. There are three categories. “Carrying” refers to patients who have to be carried on a stretcher, “Assisted” refers to patients who move by wheelchair or by accompanied walking, and “Unassisted walking” refers to patients who walk without assistance.
Scan time: Scan time is the difference between reception time and implementation time. Reception time refers to the time the patient was received into the radiological CT room. Implementation time refers to the time that the scan was completed.
Auxiliary nurse: An auxiliary nurse works under the direction of a full nurse and augments the nursing team as a member of that team. An auxiliary nurse also carries out work processes that do not require a medical license.
Result
We extracted data on 2149 cases. The breakdown of conveyance category and freedom level is shown in Table 3.
Table 3: The breakdown of conveyance category and freedom level.
| Carrying | Assisted | Unassisted walking | |
|---|---|---|---|
| Freedom level I | 1332 | 52 | - |
| Freedom level II | 63 | 200 | - |
| Freedom level III | 58 | 216 | - |
| Freedom level VI | - | 51 | 177 |
-no applicable data
Obtaining scan time coefficients
The mean scan time per 1 non-enhanced head CT was 5.82 ± 3.83 minutes. The scan time for carrying/freedom level I patients was 6.59 ± 4.27 minutes, which is significantly longer than the times for carrying/freedom levels II and III. The scan time for assisted/freedom level I patients was 7.03 ± 4.21 minutes, which is significantly longer than the times for assisted/freedom levels II and III patients. Thus, in both the carrying and assisted categories, the scan time for freedom level I patients are longer. This finding suggests that scan time varies depending on patient freedom level rather than conveyance category. The cases with a scan time coefficient of 1.00 or more-in other words, cases with an above-average scan time-were as follows: carrying/freedom level I: 1.13; carrying/freedom level III: 1.01; assisted/freedom level I: 1.21; assisted/freedom level IV: 1.014 (Table 4).
Table 4: Scan time coefficients and Personnel cost coefficient.
| Conveyance | Freedom level | Scan time | k | Personal cost | r |
|---|---|---|---|---|---|
| category | |||||
| Carrying | I | 6.59 ± 4.27** | 1.13 | 645.66 | 1.51 |
| II | 5.54 ± 2.90 | 0.95 | 543.1 | 1.27 | |
| III | 5.90 ± 3.87 | 1.01 | 578.4 | 1.35 | |
| Assisted | I | 7.03 ± 4.21** | 1.21 | 433.94 | 1.02 |
| II | 5.19 ± 3.70 | 0.89 | 320.53 | 0.75 | |
| III | 5.10 ± 3.96 | 0.88 | 314.78 | 0.74 | |
| IV | 6.06 ± 4.38 | 1.04 | 374.29 | 0.88 | |
| Unassisted walking | IV | 5.18 ± 3.36 | 0.89 | 207.18 | 0.48 |
Mean ± SD (minutes)
**p-value<0.01, k: scan time coefficient, r: personal cost coefficient
Obtaining personnel cost coefficient
The mean personnel cost per 1 non-enhanced head was 427.24 yen. The cost for carrying/freedom level I was the highest at 1.51, followed by carrying/freedom level III at 1.35 and carrying/ freedom level II at 1.27. All of these cases have above-average personnel cost. Assisted/freedom level I was around the mean personnel cost at 1.02. However, assisted/freedom levels II (0.75), III (0.74), and IV (0.88) were all under the mean, at less than 1.00. For the unassisted walking category, freedom level IV was 0.48, approximately one third the personnel cost of the case with the highest personnel cost, namely, carrying/freedom level I (Table 4).
Exploring the potential for applying to an EMC system
Table 5 shows the three patterns of combinations of patients’ conditions based on random numbers assuming 10 patients subject to the test.
Table 5: The three patterns of combinations of patients’ conditions based on random numbers assuming 10 patients subject to the test
| Conveyance | Freedom level | Pattern1 | Pattern2 | Pattern3 |
|---|---|---|---|---|
| category | ||||
| Carrying | I | 3 | 0 | 2 |
| II | 1 | 1 | 2 | |
| III | 1 | 2 | 0 | |
| Assisted | I | 1 | 1 | 1 |
| II | 2 | 2 | 2 | |
| III | 0 | 1 | 1 | |
| IV | 2 | 1 | 1 | |
| Unassisted walking | IV | 0 | 2 | 1 |
unit:people
Table 6 shows the values obtained by multiplying scan times by number of patients. It also shows the personnel cost coefficients and the added scan time coefficients for each pattern. In Table 7, the aggregated scan time’s coefficients for each pattern have been multiplied by the mean scan times and mean personnel costs, respectively. Pattern 1 had an aggregated scan time coefficient of 10.43, the highest among the three patterns. Multiplying the mean scan time (5.82 minutes) resulted in 60.70 minutes. Pattern 2’s aggregated scan time coefficient was 9.66 minutes. Converting this value into the mean scan time resulted in 56.24 minutes. Pattern 3’s aggregated scan time coefficient was 9.96 minutes. Multiplying this with the mean scan time resulted in 57.97 minutes. The difference between Patterns 1 and 2 corresponds to the time taken for a single non-enhanced head CT scan.
Table 6: The personnel cost coefficients and the added scan time coefficients for each pattern
| Conveyance | Pattern1 | Pattern2 | Pattern3 | ||||||
|---|---|---|---|---|---|---|---|---|---|
| Freedom level | k | r | k | r | k | r | |||
| Category | |||||||||
| Carrying | I | 3.39 | 4.53 | 0 | 0 | 2.26 | 3.02 | ||
| II | 0.95 | 1.27 | 0.95 | 1.27 | 1.9 | 2.54 | |||
| III | 1.01 | 1.35 | 2.03 | 2.71 | 0 | 0 | |||
| Assisted | I | 1.21 | 1.02 | 1.21 | 1.02 | 1.21 | 1.02 | ||
| II | 1.78 | 1.5 | 1.78 | 1.5 | 1.78 | 1.5 | |||
| III | 0 | 0 | 0.88 | 0.74 | 0.88 | 0.74 | |||
| IV | 2.08 | 1.75 | 1.04 | 0.88 | 1.04 | 0.88 | |||
| Unassisted walking | IV | 0 | 0 | 1.78 | 0.97 | 0.89 | 0.48 | ||
| Total | 10.43 | 11.43 | 9.66 | 9.08 | 9.96 | 10.18 | |||
Multiplied by a coefficient to each pattern
Table 7: The aggregated scan time coefficients for each pattern have been multiplied by the mean scan times and mean personnel costs, respectively
| Scan time(minutes) | Personnel cost | |
|---|---|---|
| (yen) | ||
| Pattern1 | 60.7 | 4882.11 |
| Pattern2 | 56.24 | 3878.37 |
| Pattern3 | 57.97 | 4348.81 |
As for the value multiplied by personnel cost coefficients and the aggregated scan time coefficients for each pattern, Pattern 1’s aggregated personnel cost coefficient was 11.43, Pattern 2’s was 9.08, and Pattern 3’s was 9.96. Pattern 1’s personnel cost was 4882.11 yen, which is around 1000 yen more than Pattern 2’s personnel cost (3878.37 yen).
Discussion
The Ministry of Health, Labour and Welfare has outlined a plan to cut the number of beds by 160,000–200,000 by 2025. There is a strong possibility that local hospitals will be reorganized and high-cost medical apparatuses will be concentrated. In other words, hospitals will be pressured to share high-cost medical apparatuses. Hospitals that possess high-cost medical apparatuses can expect to see an increase in the number of scan operations. In order to deal with the increasing number of scan operations, some hospitals may consider extending the hours in which scans can be conducted or revising the system of shifts, such as conducting scans at night. However, it is reported that extending working hours and providing more services at night entails safety issues [16,17]. Thus, it is important to focus medical resources within a limited time and ensure efficient and safe provision.
In the following section, we discuss the scan time coefficients that will contribute to more efficient use of high-cost medical equipment operations, the personnel cost coefficients that will contribute to safer operations, and application to the EMC system.
The scan time results revealed that times for non-enhanced head CT scans with the same protocol can vary depending on the patient’s condition. Scan times were longer among patients with freedom level I compared to levels II, III, and IV, regardless of whether they were in the carrying or assisted category. The proximity of the scan time coefficient to 1.00 indicates the proximity of the scan time to the overall mean scan time. The coefficient for carrying/freedom level II was k=0.95, and same for carrying/freedom level III was k=1.01; these are both close to the mean time. However, assisted/freedom level I showed a coefficient of k=1.21, denoting a scan time 1.21 times the mean. This finding suggests that the extra time taken is not attributable to the conveyances, but rather to the patient’s condition. Conveyance categories are used as items that describe patients’ means of mobility in the hospital, but referring to the patient’s freedom level, which describes their condition, may lead to more accurate scan time predictions. There were some cases where the freedom level was incongruent with the conveyance category; for example, freedom level III patients who required carrying, and freedom level IV patients who required assisted movement. However, an examination of the details revealed that these patients may have required such conveyances for particular reasons such as having epilepsy, or being unable to communicate with medical care providers.
Regarding personnel costs, which reflect both the personnel required to convey the patient and the scan time, the coefficient for freedom level 1 patients who were assisted was closest to the mean personnel cost at r=1.02, denoting that the personnel costs for such patients are average. Regardless of freedom level, the coefficients for patients requiring carrying were all above 1.00, denoting above-average personnel costs. This increased cost reflects not only the extra scan time but also the presence of nursing staff that carry the patient. The coefficient for unassisted walkers with freedom level IV was r=0.48, which is one third of the case for the highest personnel cost, namely, carrying/ freedom level I, r=1.51. This finding suggests that the patient’s ADLs are a powerful determinant of the workforce that will be required. Given that the personnel costs for the same type of scan vary depending on the patient’s condition, personnel cost coefficients may serve as a yardstick for making objective evaluations of work.
We devised three hypothetical patterns of 10 non-enhanced head CT scans that take place in a day. Pattern 1 had many patients with poor conditions; four of the patients were freedom level I. Compared to Pattern 2, more time was taken per scan, which is attributable to the patients’ conditions. This finding suggests that it is important to consider the patient’s condition by obtaining scan time coefficients that reflect a combination of patient freedom level and conveyance category. The conveyance category and freedom level items have been input into the existing system, meaning that it will be possible to vary the timeframes without adding any new items. Furthermore, such scan time coefficients can be applied not only to non-enhanced head CT scans but also to photographing diagnostics to be applied to other body parts.
Pattern 1, in which there were many carrying cases, had the highest coefficient total. Pattern 1 cases required 1.26 times the personnel cost of Pattern 2 cases. This result is attributable to the fact that a nurse and an auxiliary nurse are required to carry such patients and the fact that scan times are longer. It is conceivable that freedom level 1 patients are unstable. Thus, in order for radiological technologists to administer a scan safely, it is necessary to have photographic technology that is tailored to the condition of the patient. Using personnel cost coefficients will enable work to be evaluated in a way that reflects patient condition as opposed to only reflecting number of scans and scan protocol. By incorporating this data into the EMC system, it will be possible to ascertain objectively the required personnel cost for the scan in advance, thereby helping to reduce disproportionate workload allocations and ensure safe scans. In order to incorporate the data into the EMC, it will be necessary to consider how scan time and personnel costs are affected by whether the scan involves contrast radiography, and consider other modalities such as MRI. It will also be important to refine conveyance category divisions and freedom level. It has become necessary to improve the precision of diagnostic costs analyses by shifting the focus from individual conditions to individual patients [18]. In this study, we obtained scan times that reflect the various patient conditions, and we also obtained personnel cost coefficients. In so doing, we demonstrated that varying timeframes for high-cost medical equipment may lead to more efficient use and enable service to be assessed in a way that reflects patient condition. The results of the study show that there is much potential for standardizing work, appropriately placing medical staff, and providing objective work assessment.
Conclusions
Referring to conveyance category and freedom level will increase the accuracy of scan time predictions. Given that the personnel costs for the same type of scan vary depending on the patient’s condition, personnel cost coefficients can serve as a yardstick for objective evaluations of work. It is possible to apply to the EMC system without adding any new items. Doing so will contribute to the appropriate allocation of scan timeframes, objective evaluation of work, and the standardization of service. It will also make medical care safer and more efficient.
Conflicts of Interest
The authors declare that they have no conflicts of interest in the research.
Compliance with ethical standards
This study was approved by the medical ethics committee of Kagoshima University (number 27-72).
Acknowledgment
We would also like to extend our gratitude to everyone at the Kagoshima University Hospital’s Department of Medical Informatics who kindly helped us obtain the data.
References
- Hamada H, Sekimoto M, Imanaka Y (2012) Effects of the per diem prospective payment system with DRG-like grouping system (DPC/PDPS) on resource usage and healthcare quality in Japan. Health Policy107: 194-201.
- Matsuda S, Okochi J(2004)The historical analysis of Japanese fee schedule in the social health insurance. Journald’ Economie Medicale 22:27-38.
- 2014 version of the Ministry of Health, Labor and Welfare White Paper.
- Baker ME, Hesselink D, Borkowski GP, Modic MT (1998) Cost accounting in radiology: building a cost model using hospital-based, commercially available software. AJR Am J Roentgenol 171:7-12.
- Hillman BJ (1994) New imaging technology and cost containment. AJR Am J Roentgenol 162:503-506.
- Saini S, Shama R, Levine LA, Bramson RT, Jordan PF, et al. (2001) Technical Cost of CT Examinations. Radiology 218:172-175.
- Saini S, Seltzer SE, Bramson RT, Levine LA, Kelly P, et al. (2000) Technical Cost of Radiologic Examinations: Analysis across Imaging Modalities. Radiology 216: 269-272.
- Kita Y, Shimizu M, Aratani M, Sakamoto K, Hirata T, et al. (2009) Review of Efficiency Analysis of Productivity in Health Care Services. Kawasaki Medical Welfare Journal 19: 25-34.
- Uto Y, Muranaga F, Usuki K, Kumamoto I(2003) Development of Cost Accounting System to Optimize Quality and Cost Control. Japan Journal of Medical informatics 23: 23-31.
- Muranaga F, Kumamoto I, Uto Y (2007) Development of hospital data warehouse for cost analysis of DPC based on medical costs. Methods of information in medicine 46: 679-685.
- Torigoe C, Mukaikubo S, Uto Y (2008) Development on nursing information system using data on index of patient's need for nursing of Kagoshima University. 9th Nursing Informatics Society Paper of Japan Association for Medical Informatics 137-140.
- Mahlen K (1999) RVUs: Relative value units or really very useful? Issues in Cost Accounting for Health Care Organizations 4: 104-162.
- Glass, Kathryn P (2003) RVU's: Applications for medical practice success.
- Finkler, Steve A, David Marc Ward (1999) Essentials of cost accounting for health care organizations.
- Adachi S (2010) A study on the homogeneity of costs in hospital cost accounting: an analysis of the Relative Value Unite method Thekeizaironkyu138: 1-19.
- Rogers Ann E, Hwang WT, Scott LD, Aiken LH, Dinges DF (2004) The working hours of hospital staff nurses and patient safety. Health affairs 23: 202-212.
- Muecke S (2005) Effects of rotating night shifts: literature review. Journal of advanced nursing 50: 433-439.
- Pengyu Cao (2006) Algorithms to Reduce Cost Drivers of Activity-Based Costing and Evaluation of the Accuracy of Cost Estimation in a Hospital. Niigata Medical Journal 120: 214-221.
Open Access Journals
- Aquaculture & Veterinary Science
- Chemistry & Chemical Sciences
- Clinical Sciences
- Engineering
- General Science
- Genetics & Molecular Biology
- Health Care & Nursing
- Immunology & Microbiology
- Materials Science
- Mathematics & Physics
- Medical Sciences
- Neurology & Psychiatry
- Oncology & Cancer Science
- Pharmaceutical Sciences