Application of Screening Effect when Sampling Suspension in Bioremediation Process
Ukpaka CP1 and Igwe FU2
DOI10.21767/2471-9927.100028
1Department of Chemical/Petrochemical Engineering, Rivers State University of Science and Technology, Nigeria
2Department of Biochemistry, Rivers State University of Science and Technology, Nigeria
- *Corresponding Author:
- Ukpaka CP
Department of Chemical/Petrochemical Engineering
Rivers State University of Science and Technology, Nigeria
Tel: +234 903 885 8167
E-mail: chukwuemeka24@yahoo.com
Received date: December 29, 2016; Accepted date: March 02, 2017; Published date: March 12, 2017
Citation: Ukpaka CP, Igwe FU. Application of Screening Effect when Sampling Suspension in Bioremediation Process. J Health Med Econ. 2017, 3:1. doi: 10.21767/2471-9927.100028
Abstract
Investigation was conducted to examine the significant impact of screening on total phosphate and total nitrogen in soil and water environment polluted by crude oil in Niger Delta area of Nigeria. Matrix Laboratory (MATLAB) computer programme language technique’s was inputted from date obtained experimentally as presented in this research work. The effect of screening on sampling of some parameters in terms of colour change on the effective measures to improve bioremediation of pollutants in water and soil environment is a matter of urgent concern to the Chemical engineers, since the intersurface contact is a contributing factor for efficiency of the process. This research demonstrates the significance of screening effect when sampling suspension in bioremediation process using the application of mat lab computer programme language in examining the functional parameters. This research is also aimed at comparing the bioremediation and the effect of screening in suspension of physicochemical in the suspended components to check for the effect and the rate of contributing factors as presented in this research work.
Keywords
Application; Screening effect; Sampling; Suspension; Bioremediation
Introduction
Environmental pollution of water and soil with petroleum and petrol chemical derivatives has been recognized as one of the most serious problems. There has been increasing concern over the accidental spillage of petrol chemical derived hydrocarbon compounds during technological processes and transportation. Many of these hydrocarbons are considered to be a potential health hazard [1-4]. Physical treatment, using sobbing material followed by incineration for oil removal, is one of the oldest and simplest methods used. This method proved not to be a practical method since it must be used right after the spill occurring, whereas, chemical treatment using chemical emulsifier, proved to be expensive and cannot remove the oil absolutely from the polluted site [5-8]. Bioremediation involves the use of microorganisms or microbial processes to contaminants, attempts to accelerate the natural degradation rates by overcoming factors that limit microbial degradation [9-10]. Conditions for biodegradation are optimized by modifying environmental factors such as pH, temperature, aeration and nutrient addition the process of bio-stimulation [11].
The successful application of bioremediation depends on appropriate bio-gradated microbes and environmental parameters. There are few studies on microbial oil degradation in normal soils. Hydrocarbon degrading microbes have been detected [12]. It has been established that bacteria, not fungi, are the major micro flora of oil contaminated soils. Despite the huge potential of microorganisms to degrade organic compounds under favorable conditions, no single species of microorganism can degrade all the components of petroleum oil and no oildegrading “superbug” has been engineered. Currently, several organisms are known, each is usually capable to degrade one or, at least, a few petroleum components at a time. The main method that experimental design was the change of one variable at a time method [13-19]. This is an experimental method in which a single factor is varied, while other factors are kept fixed at a specific set of condition. This method leads to unreliable results and wrong conclusions, and is inferior to the factorial design method [20-25]. Therefore, the screening design is appropriate to face the large number of cultural conditions under investigation. Plackett- Burman design comprises of one type of a two-level screening design. It is favored to detect the significant factors affecting the process before proceeding to the optimization stage of experimental design [26-27].
The aim of this work is to investigate the effect of screening when sampling suspension in bioremediation of petroleum oil by locally isolated microorganisms. The objective was to evaluate the effects of the screening conditions, represented as media components and environmental factors, on the bioremediation and biodegrading of petroleum oil. This is needed to develop a near optimal medium in order to enhance effectiveness on the screening when sampling suspended substances in the bioremediation process by means of statistically designed experiments.
Materials and Methods
The mat lab computer programme language was used in investigating the screening effect of sampling when a suspension is experienced in sampling bioremediation processes. In this case, an experimental data obtained was formulated and expressed in terms of Matrix to analyze the rate of concentration effect upon the influence of screening when suspension if formed in the bioremediation of polluted site with crude oil. The general form of matrix is given by considering the general formula for matrix which is given thus. The concentration of total phosphate and nitrogen was sampled for various time and the mean average evaluated for different series as presented in the work.
Phosphate
Phosphate determination was by the turbid metric method (APHA, 1995). To a 50 mL sample or portion diluted to 50 mL contained in a conical flask, 2.5 mL of conditioning reagent and a quarter spatula full barium chlorides (BaC12) were added. The mixture was swirled for a minute and the barium sulfate (BaSO4) turbidity read at the fifth minute on Spectronic 21D at 420 nm against distilled water. Sulfate level was read from a calibration curve prepared for known sulfate standards treated the same way as the samples and concentration calculated from:

Where, C is mg SO4/50 mL read from calibration curve. The detection limit is 1.0 mg/1.
Nitrate-Nitrogen
Nitrate measurement was by the Brucine method (APHA, 1995). To a 2.5 mL sample contained in test tube (immersed in ice-cold water), 2.5 mL of 4.0N of H2SO4 solution was added and mixed by gentle swirling. After cooling, 0.2 mL brucine sulfate solution was added with mixing. The treated samples in test tube rack were placed in a boiling water bath for 25 min for color development. After cooling the absorption of the resulting yellow color was read on Spectronic 21D at 410 nm. The nitrate-nitrogen was read from calibration curve treated in the same way as the samples. Limit of detection is 0.05 mg/1.
Results and Discussion
The results obtained are presented in tables and figures as shown in this research work.
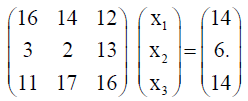
The general form of matrix 9 (Table 1) is given by
| Time/day | Sample | 1st (mg/s) | 2nd (mg/s) | 3rd (mg/s) | Average |
|---|---|---|---|---|---|
| 7 | A | 16 | 14 | 12 | 14 |
| 14 | B | 3 | 2 | 13 | 6 |
| 21 | C | 11 | 17 | 16 | 14 |
Table 1: The concentration of the Total Phosphate for various sampling period for Soil polluted with crude oil.


The general form of matrix (Table 2) is given by
| Time/Day | Sample | 1st (mg/s) | 2nd (mg/s) | 3rd (mg/s) | Average |
|---|---|---|---|---|---|
| 7 | A | 1.86 | 0.73 | 0.86 | 1.15 |
| 14 | B | 0.33 | 0.177 | 2.4 | 0.969 |
| 11 | C | 0.08 | 2.47 | 1.66 | 1.403 |
Table 2: The Concentration of the Total Phosphate for various Sampling Period for River Water Polluted with Crude Oil.


The general form of matrix (Table 3) is given by
| Time/Day | Sample | 1st (mg/s) | 2nd (mg/s) | 3rd (mg/s) | Average |
|---|---|---|---|---|---|
| 7 | A | 0.018 | 1.01 | 0.21 | 0.34 |
| 14 | B | 0.031 | 0.011 | 0.034 | 0.025 |
| 21 | C | 0.08 | 4.7 | 1.17 | 1.983 |
Table 3 The concentration of the total nitrogen for various sampling period.


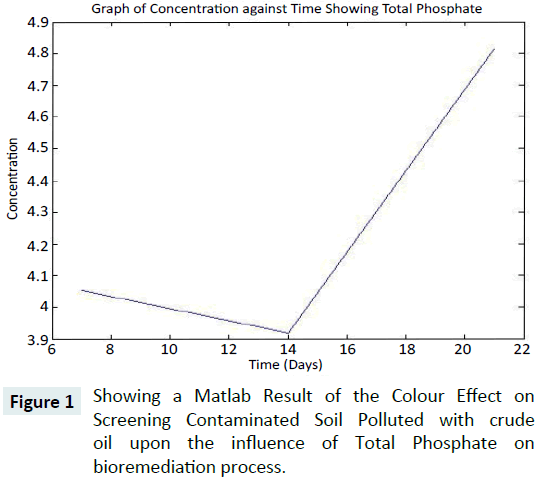
The results presented in Figure 1 demonstrate the effect of screening when sampling soil polluted with crude oil upon the influence of bioremediation. The colour effect can be attributed to the following functional parameters such as, the concentration of the total phosphate, microbial concentration, pollutant concentration, soil sample characteristics as well as the period of exposure before carrying out the bioremediation and including the environmental factors. The concentration of the total phosphate decreases with increase in time and suddenly increases with increase in time. The variation on the concentration of the total phosphate can be attributed to the variation in time as presented in Figure 1.
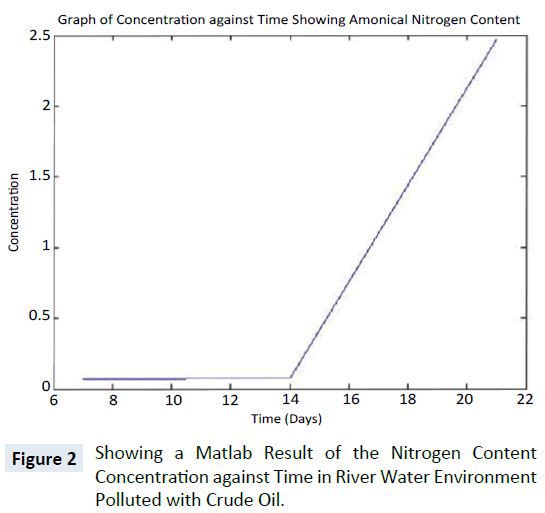
Effect on Screening Contaminated River Water Polluted with crude oil upon the influence of time for nitrogen concentration on bioremediation process is illustrated in Figure 2.
The results presented in Figure 2 demonstrates the effect of screening when sampling soil polluted with crude oil upon the influence of bioremediation in the evaluation of the nitrogen concentration. During the sampling processes a colour change was observed to be attributed to the following functional parameters of the concentration of the nitrogen characteristics as well as the period of exposure before carrying out the bioremediation and including the environmental factors. The concentration of the nitrogen decreases with increase in time suddenly increases with increase in time. The variation on the concentration of the nitrogen can be attributed to the variation in time as presented in Figure 2.
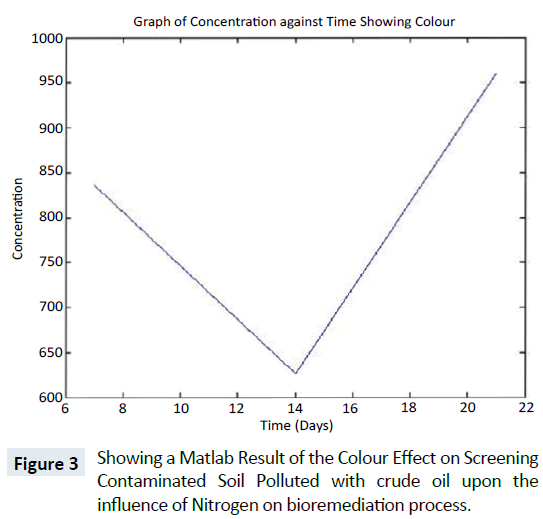
Effect on Screening Contaminated soil Polluted with crude oil upon the influence of time for nitrogen concentration on bioremediation process is illustrated in Figure 3.
The results presented in Figure 3 demonstrates the effect of screening when sampling soil polluted with crude oil upon the influence of bioremediation in the evaluation of the nitrogen concentration. During the sampling processes a colour change was observed to be attributed to the following functional parameters of the concentration of the nitrogen characteristics as well as the period of exposure before carrying out the bioremediation and including the environmental factors. The concentration of the nitrogen decreases with increase in time suddenly increases with increase in time. The variation on the concentration of the nitrogen can be attributed to the variation in time as presented in Figure 3. The colour effect can be attributed to the following functional parameters nature of the reagents, pollutant concentration as well as the period of exposure before carrying out the bioremediation and including the environmental factors.
Conclusion
The following conclusion was drawn from the research work such as:
1. Screening process will help improve the environmental safety on the hazard associated with sampling suspended system.
2. The screening will be found useful in effective and efficient management of our ecosystem when bioremediation process is applied
3. Reduction on the inhibiting effect on bioremediation process will be achievable
4. Screening will activate and stimulate the bioremediation process
5. Screening will increase the inter-surface contact for effective remediation of the process.
References
- Ukpaka CP, Musa AS (2009) Evaluation of crude oil degradation in fresh water contaminated site. The Nigeria Academic Forum: A multi-disciplinary Journal 16: 4-13.
- Ukpaka CP, Umesi N (2009) Bio kinetic model for adiabatic process of petroleum hydrocarbon degradation in a batch reactor. Knowledge Review: A multidisciplinary Journal 17: 6-21.
- Ukpaka CP, Nnadi VG (2009) Modelling the biodegradation of benzyl chloride contaminants in a continuous stirred tank reactor (CSTR). Journal of Modelling, Simulation and Control (AMSE) 70: 67-90.
- Mueller G, Cerniglia CE, Pritchard PH (1996) Bioremediation of Environments Contaminated by Polycyclic Aromatic Hydrocarbons. Cambridge University Press pp: 125-194.
- Ukpaka CP (2009) Development of Mathematical Correlative Model equation for the Microbial Growth in Biodegradation of Benzyl chloride in a CSTR. Knowledge Review: A Multi-disciplinary Journal 19: 86-98.
- Ukpaka CP, Ogoni HA, Amadi SA, Akor AJ (2009) Dry Season Predictive Technique for Estimating the Hydrocarbon Degradation in a Continuous Discharge of wastewater in pond system. The Nigerian Journal of Research and Production 15: 30-53.
- Ukpaka CP, Abowei FM, Okerie FU (2009) Evaluation of Bio-Stimulation rate of BTEX Compounds of contaminated site. Multidisciplinary Journal of Research Development 12: 15-36.
- Ukpaka CP (2009) Development of 3-Dimensional model for predicting C-groups hydrocarbon degradation in pond system upon the influence of momentum transfer for dry season. The Nigerian Academic Forum, A Multidisciplinary Journal 17: 54-75.
- Mulkins GI (1979) Effect of Effect of environmental parameters on Bacterial Degradation of Bunker-C-Oil, crude oils and Hydrocarbons. Applied Micro Biology 28: 915-922.
- Ukpaka CP, Nnadi VG, Umesi N (2009) Experimental investigation of the thermo remediation effect of BTEX contaminants on the Germination of Cowpea. The Nigerian-Academic Forum: A Multidisciplinary Journal 17: 11-27.
- Ukpaka CP (2009) Development of the Bio kinetic model for the production of ammonia from urea in a Continuous Stirred Tank Reactor (CSTR). Knowledge Review: A multidisciplinary Journal 19: 34-40.
- Ukpaka CP, Ogoni HA, Amadi SA, Akor AJ (2009) Development of Bio kinetics Model for the prediction of Biochemical Oxygen Demand in a pond system for dry season degradation of Petroleum Hydrocarbon. The Nigerian Academic Forum: A Multidisciplinary Journal 17: 83-98.
- Okerentugba PO, Ezeronye OU (2003) Petroleum degrading potentials of single and mixed microbial cultures isolated from rivers and refinery effluents in Nigeria. Afr J Biotechnol 2: 288-292.
- Ukpaka CP, Ogoni HA, Amadi SA, Akor AJ (2009) Mathematical model for the prediction of dissolved oxygen kinetics for dry season degradation of petroleum hydrocarbon in pond system. Multidisciplinary Journal of Research Development 9: 23-36.
- Ukpaka CP (2009) Development of Bio kinetic model for the production of Ammonia from urea in a batch reactor. Knowledge review: A Multidisciplinary Journal 19: 28-39.
- Ukpaka CP, Farrow ST (2009) Development of model for temperature distribution on fin material during ethanol production. Nigerian Journal of Research and Production 14: 202-217.
- Ukpaka CP, Amadi SA, Umesi N (2009) Modelling the physical properties of activated sludge biological wastewater treatment system in a plug flow reactor. The Nigeria Journal of Research and Production: A Multidisciplinary Journal 15: 37-56.
- Ukpaka CP (2011) Modelling the prediction of bio kinetics of dissolved oxygen for wet season degradation of petroleum hydrocarbon in pond system. International Journal of Pharma world Research 2: 1-27.
- Ukpaka CP (2011) Evaluation of Bio kinetic model for the prediction of biochemical oxygen demand in a pond system for wet season degradation of petroleum hydrocarbon, International Journal of Pharma world Research 2: 1-26.
- Ukpaka CP, Umesi N, Gumus RH (2009) Development of mathematical model for an adiabatic operation on Biodegradation of petroleum Hydrocarbon in a Plug flow Reactor. Multidisciplinary Journal of Research Development 12: 91-111.
- Ukpaka CP, Amadi SA (2009) Comparison of microbial Induced Corrosion in Different Crude Oil Sludge in Niger Delta Area. Journal of the Nigerian Society of Chemical Engineers 24: 107-133.
- Ukpaka CP, Eno Okon, Farrow TS (2010) Modelling the effect of physical parameter: Euler and Stanton Number on the Temperature Fields and Velocity of gas distribution on a Steam heater Tube. A Multidisciplinary Environ. Agric. Science & Techno 1: 1-18
- Ukpaka CP (2010) Model for the prediction of C-groups hydrocarbon remediation in activated pond system for dry season upon the influence of momentum transfer. Journal of Modeling, Simulation and Control (AMSE) 71: 23-30.
- Ukpaka CP, Davis DD (2010) Studying the Biodegradation of petroleum Hydrocarbon in Soil using Pseudomonas sp. In Niger Delta Area of Nigeria. Multidisciplinary Journal of Academic Excellence 1: 1-15.
- Ukpaka CP (2011) Predictive Techniques to estimate the oxygen utilization by Pseudomonas Aeruginosa in petroleum Hydrocarbon in a fluidized bed Reactor. ICASTOR Journal of Engineering 4: 91-106.
- Ukpaka CP (2011) Development of mathematical model for the prediction of microbial growth rate of Bacteria and fungi in BTX contaminants Degradation in soil Environment. International Journal of Current Research 2: 1-23.
- Ukpaka CP (2010) Investigation into the Rain Water quality of Ogba Community in Niger Delta Area of Nigeria. The Nigerian Academic Forum: A Multidisciplinary Journal 18: 1-11
Open Access Journals
- Aquaculture & Veterinary Science
- Chemistry & Chemical Sciences
- Clinical Sciences
- Engineering
- General Science
- Genetics & Molecular Biology
- Health Care & Nursing
- Immunology & Microbiology
- Materials Science
- Mathematics & Physics
- Medical Sciences
- Neurology & Psychiatry
- Oncology & Cancer Science
- Pharmaceutical Sciences
